Bitcoin achieved a major symbolic milestone earlier this year surpassing $1 trillion in market capitalization. With broader notoriety, famed billionaire investors like Stanley Druckenmiller and Paul Tudor Jones and institutional investors like BlackRock have jumped on the cryptocurrency bandwagon.
It’s no surprise why. U.S. monetary and fiscal policymakers continue to spend trillions to prop up the ailing U.S. economy all the while debasing the value of the U.S. dollar. Add in financial system bailouts and political distrust, and you’ve got a perfect storm for Bitcoin’s rise.
On the road to broader crypto dominance, Bitcoin’s volatility has created numerous opportunities for cryptocurrency holders to accumulate more Bitcoin at better prices.
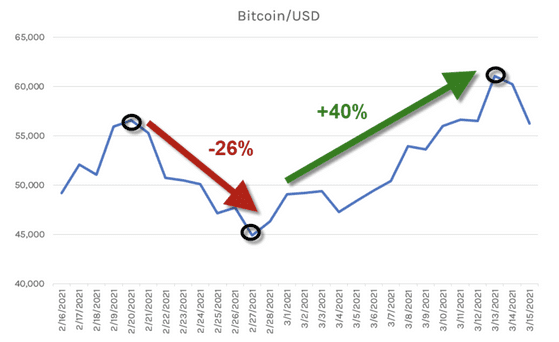
Take Bitcoin’s recent February drawdown as an example. Bitcoin fell -26% in a week (between 2/21 and 2/28) before rebounding more than +40% from the lows to mid-March prices. (Our "Bitcoin Trend Tracker" has had Bitcoin in a bearish trend since 5/19.)
The good news… there were identifiable signs of speculative excess in Bitcoin that could’ve helped you sidestep the carnage and buy the dip.
The process of any asset peaking, selling off and rebounding again follows a predictable rhythm. The most important market dynamics to watch for any asset are its underlying price, volume and volatility.
At a peak (and before a selloff), Bitcoin holders might expect to see the following characteristics:
All of this was present in Bitcoin’s most recent selloff and the subsequent rally in February.
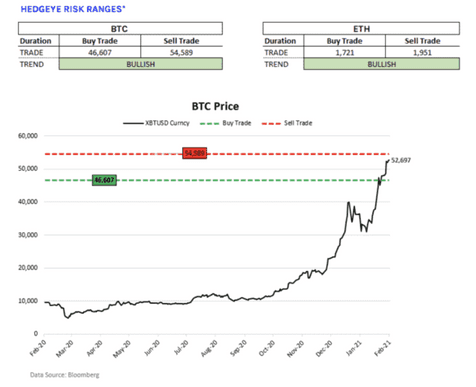
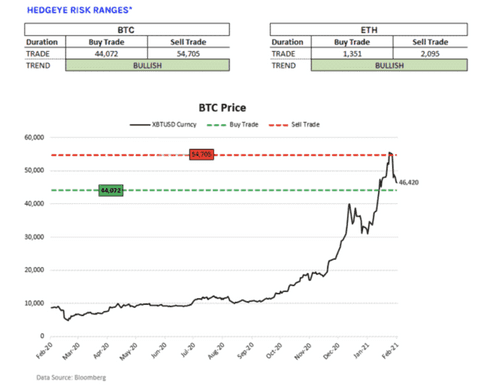
Here are Hedgeye’s Risk Ranges (based on price, volume and volatility) for Bitcoin on February 19th (just before Bitcoin’s peak).
The top end of the Bitcoin risk range was 54,589 (meaning be more cautious at those levels) and low end was 46,607 (i.e. a high probability bet to “buy the dip).
With Bitcoin approaching the top end of our Bitcoin Risk Range that implied Bitcoin had nearly -15% downside to the low end of the range.
PRICE
starts to flatten out, as the pace of buyers and sellers equalize
VOLUME
amount of buying and selling declines, as market participants signal lack of conviction in current prices
VOLITILITY
starts rising off its lows, as price moves become more drastic
Eventually, panic sets in and the following market dynamics take over: Prices decline, volume of selling rises and volatility spikes more violently.


Again, our Bitcoin Trend Tracker uses Bitcoin’s underlying price, volume and volatility trends to estimate the probable range for the cryptocurrency.
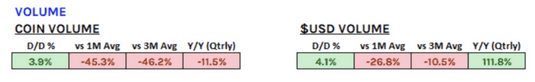
Here’s a quick look under the hood on February 19th using Bitcoin’s underlying price, volume and volatility data.
As Bitcoin hit new highs, coin trading volume was plummeting, -45% versus the 1-month average. Fewer transactions at Bitcoin’s all-time highs? Not good.
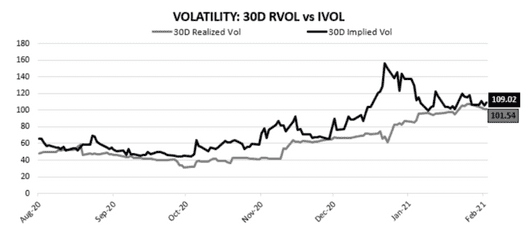
Meanwhile, Bitcoin volatility was creeping higher. Historical (or realized) volatility was steadily rising throughout the year. At the same time, expectations of future volatility (i.e. “implied volatility”) were falling.
This is a classic contrarian indicator.
In simple terms, as Bitcoin hit all-time highs (rising 100% in 2021) institutional investors were removing downside hedges on Bitcoin to capture the parabolic move higher… at precisely the wrong time.
The Crash: From Down -26% to Up +40%
The Bitcoin peak culminated over the weekend of February 20-21 when Bitcoin closed north of 56,000 only to plummet the following week.
As Bitcoin tumbled and headlines talked about a “Bitcoin flash crash,” the low end of our refreshed Bitcoin Risk Range coalesced around 44,000 on February 26th.
Once again, underlying Bitcoin price, volume and volatility dynamics started to signal a bottom in the cryptocurrency. Volatility started to fall, and volume began to reaccelerate. That weekend (February 27-28) Bitcoin hit a low of 43,119 and completed its -26% drop before a meteoric +40% rise in the coming trading days.
Bitcoin Trend Tracker: A Buy Low, Sell High Tool
We think our “Bitcoin Trend Tracker” is the world’s most comprehensive crypto risk management tool for the world’s largest cryptocurrency.
The data above is a tiny sliver of what’s included in our “Bitcoin Trend Tracker.” Also included? Buy low, sell high Risk Ranges for Ethereum, Grayscale’s Bitcoin Trust (GBTC), Microstrategy (MSTR) and much, much more.
Bottom Line: We think you’re crazy not to have all this information at your disposal to confidently trade crypto.
But don’t take our word for it. Give the Bitcoin Trend Tracker a free, no-strings-attached try for yourself. We’re offering 30-days completely free (no credit card required).
After 30-days your Bitcoin Trend Tracker subscription will simply expire. We’ll reach out to see what you think. If you enjoy our Bitcoin Trend Tracker, sign up. If it isn’t for you, no action is required.
TRY BITCOIN TREND TRACKER FREE
Join our community
Contact Us
Email : contact@fudxcoin.com
Web : https://www.fudxcoin.com
Office:
US : 1309, Coffeen Ave Ste 1200 sheridan WY 82801
UK : 127 Fencepiece Road, Ilford, Essex, United Kingdom, IG6 2LD